Login with Google
IoT Serial Monitor
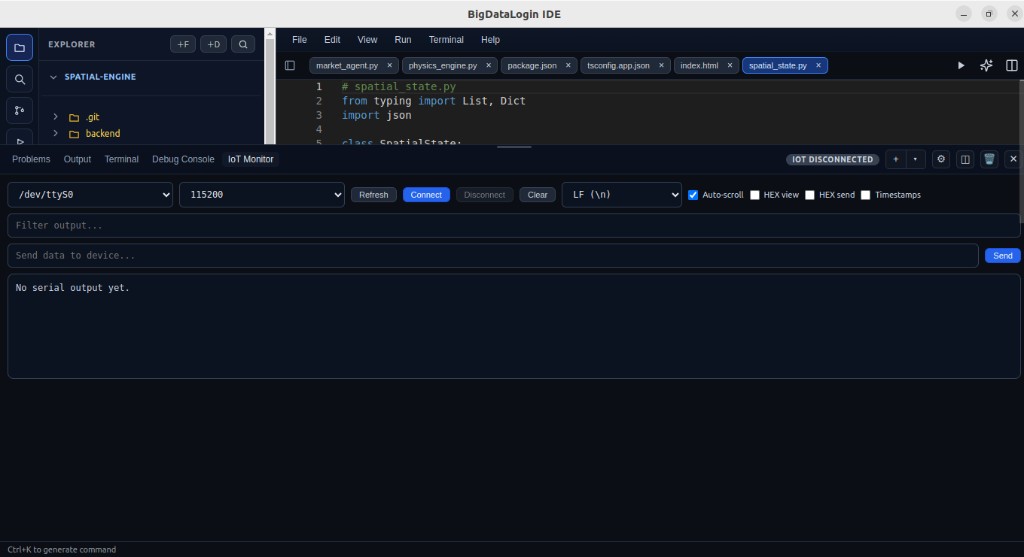
The IoT Monitor panel in AI Code Express (ACE IDE) is a built-in USB serial terminal. Use it to read live output from microcontrollers, edge devices, and sensors—and send commands back—without leaving your editor.
When to use it
- Firmware log inspection — Watch boot messages, stack traces, and debug prints as your device runs.
- Device bootstrap validation — Confirm the board enumerates and prints the expected startup sequence.
- Runtime diagnostics — Monitor temperature, signal strength, latency, or custom telemetry during field testing.
- Protocol debugging — Switch to HEX view when you need to inspect binary frames or raw bytes.
Pair serial output with the regular Terminal tab (builds, flashes, tests) and Run workflows for faster root-cause analysis.
Open the IoT Monitor
- Open AI Code Express and load your project folder.
- Open the bottom panel if it is hidden (
Ctrl/Cmd + Jor Terminal → Show Terminal Panel). - Click the IoT Monitor tab, or choose Terminal → IoT Monitor from the menu bar.
The status badge shows iot connected or iot disconnected when this tab is active.
Step-by-step: connect a device
1. Plug in your hardware
Connect the device over USB (Arduino, ESP32, Raspberry Pi Pico, STM32 dev board, USB–serial adapter, etc.). Ensure any vendor drivers are installed if your OS requires them.
2. Refresh the port list
Click Refresh. ACE scans for available serial ports and shows each path with optional manufacturer and vendor/product IDs (for example /dev/ttyUSB0 or COM3).
If no devices appear:
- Check the USB cable and port.
- Confirm the device is powered and not stuck in a bootloader-only state (unless that is expected).
- On Linux, verify your user has permission to access the serial device (see Troubleshooting).
3. Choose baud rate
Select the baud rate your firmware uses. 115200 is the default and common on many modern boards. Other supported rates: 9600, 19200, 38400, 57600, and 230400.
The baud rate must match what your firmware calls in Serial.begin(...) (or equivalent) or you will see garbled output.
4. Connect
Click Connect. On success you will see:
[connected] /dev/ttyUSB0 @ 115200
Live device output streams into the panel immediately. Connect is disabled while connected; use Disconnect to release the port.
Reading output
| Control | Purpose |
|---|---|
| Auto-scroll | Keeps the latest lines visible (enabled by default). |
| HEX view | Displays incoming data as space-separated hex bytes instead of UTF-8 text. |
| Timestamps | Prefixes each chunk with a local time stamp (hour:minute:second.milliseconds). |
| Filter | Shows only lines containing your search text (streaming continues in the background). |
| Clear | Empties the on-screen buffer without disconnecting. |
Long sessions are trimmed automatically so the panel stays responsive.
Sending data to the device
- Ensure you are connected.
- Type in Send data to device... and click Send, or press Enter.
- Choose a line ending if your firmware expects one:
- No line ending — raw payload only
- LF (
\n) — common on Unix-style firmware - CRLF (
\r\n) — common on some AT-command modules - CR (
\r) — legacy serial devices
Sent traffic is logged in the output as [tx] (text) or [tx hex] (hex mode).
HEX send mode
Enable HEX send to transmit raw bytes. Enter an even number of hex characters, with or without spaces:
48 65 6c 6c 6f
This sends the bytes for Hello. Invalid or odd-length hex input is rejected with a status message.
Suggested workflow with ACE
- Edit firmware in the Monaco editor (for example
firmware/IoT_handler.cpp). - Build and flash using the Terminal tab or Run Task....
- Connect IoT Monitor and watch boot logs and sensor readings.
- Send test commands or configuration strings to the device.
- Filter or enable HEX view when debugging binary protocols.
- Enable Share with AI and click AI Debug to let ACE analyze serial output against your firmware.
Only one ACE window can hold an active serial connection at a time.
ACE AI integration (Autonomous Hardware Debugger)
When Share with AI is enabled (default), ACE attaches the last 200 lines of serial output to AI Agent requests while the IoT Monitor is connected. The Electron main process maintains a rolling serial log buffer so the AI sees live USB data—not only what is visible on screen.
| Control | Purpose |
|---|---|
| Share with AI | Include the serial log buffer in AI context |
| AI Debug | One-click prompt: analyze recent serial output and related firmware files |
Example prompts:
- "Why is my ESP32 rebooting in a loop?"
- "Parse this sensor telemetry and find the bad reading"
- "Device prints Guru Meditation Error — fix the firmware"
Hardware-debug prompts route to Gemini Pro for deeper reasoning.
Autonomous serial probes
When Share with AI is on and IoT Monitor is connected, the ACE Agent can call send_serial_command (with your approval) to:
- Send a test string or AT command to the device
- Wait for a response (default 1 second)
- Read new serial output and continue debugging in a loop
Example agent flow: analyze panic log → send AT+CSQ? → read response → patch firmware.
Auto-approve read-only queries
Enable Auto-approve read-only (default on) in IoT Monitor to skip confirmation for safe probes:
| Auto-approved | Always requires confirmation |
|---|---|
AT+CSQ?, AT+GMR?, ATI |
AT+RST, reset, flash, erase |
STATUS?, HELP, PING? |
Custom payloads with = writes |
Short queries ending in ? |
Reboot, OTA, factory reset |
Blocked commands are never sent (even if approved). Use Remember on a read-only prompt to auto-approve when the checkbox is off.
Server IoT context API
The desktop IDE syncs the rolling buffer to Laravel (10-minute cache):
| Method | Endpoint | Purpose |
|---|---|---|
GET |
/get-code/iot-context or /api/ai/iot-context |
Read latest synced snapshot |
POST |
/get-code/iot-context or /api/ai/iot-context |
Desktop pushes buffer update |
If a chat request omits iot_serial_monitor, the backend merges the cached snapshot automatically.
Log line highlighting
When ACE cites a timestamp or quoted log fragment in its reply, matching lines in IoT Monitor pulse yellow for ~12 seconds.
Troubleshooting
Port busy
Another application (Arduino IDE Serial Monitor, screen, minicom, PlatformIO monitor, etc.) may already have the port open.
- Close the other tool, then click Reconnect in the banner or Connect again.
- Or pick a different port if multiple interfaces are listed.
Permission denied (Linux)
Your user may not have access to /dev/ttyUSB* or /dev/ttyACM*.
- Add your user to the
dialoutgroup (or equivalent for your distribution), then log out and back in. - Check udev rules for custom USB VID/PID devices.
Device disconnected
The cable was unplugged, the board reset, or the port vanished.
- Re-seat USB, wait for the device to re-enumerate, click Refresh, select the port, and Connect (or Reconnect).
Garbled characters
- Baud rate mismatch — try the rate configured in firmware.
- Wrong line ending when sending — match what the device parser expects.
Serial monitor unavailable
If ACE reports that the serial module is not loaded, use a desktop build that includes the serialport dependency, or reinstall from the latest ACE release.
IoT monitor visuals

Quick reference
| Action | How |
|---|---|
| Open IoT Monitor | Bottom panel → IoT Monitor tab, or Terminal → IoT Monitor |
| List ports | Refresh |
| Connect | Select port + baud → Connect |
| Send text | Type in send field → Send or Enter |
| Send hex | Enable HEX send, enter hex bytes → Send |
| View raw bytes | Enable HEX view |
| Retry after error | Reconnect in the banner |